


Hong Kong is one of the fastest growing economy in world. Check out our infographic for latest employment statistics in Hong Kong including percentage of Employment distribution in Hong Kong, estimated monthly employment earnings by gender, estimated number of employed persons by age group and more.
Infographic by GO Globe Hong Kong Web Design Company
To Publish this Image on your Blog or Website . Copy this code
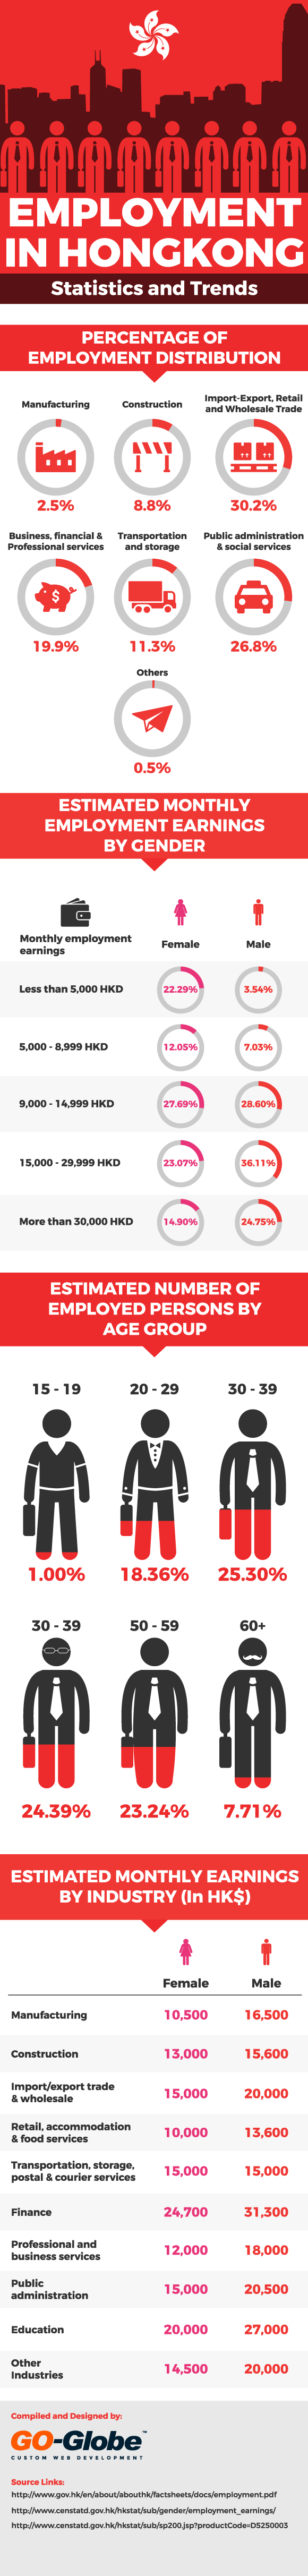
Percentage of Employment Distribution in Hong Kong (By sector)
| Industry Sector | %age |
| Manufacturing | 2.5% |
| Construction | 8.8% |
| Import-Export, Retail and Wholesale Trade | 30.2% |
| Transportation and storage | 11.3% |
| Business, financial and Professional services | 19.9% |
| Public administration and social services | 26.8% |
| Others | 0.5% |
Estimated Monthly Employment Earnings by Gender
| Monthly employment earnings (HK$) | Female | Male |
| < 3,000 | 3.91% | 1.84% |
| 3,000 - 3,999 | 3.04% | 0.85% |
| 4,000 - 4,999 | 15.34% | 0.85% |
| 5,000 - 5,999 | 2.22% | 0.99% |
| 6,000 - 6,999 | 2.14% | 1.27% |
| 7,000 - 7,999 | 2.97% | 1.67% |
| 8,000 - 8,999 | 4.72% | 3.10% |
| 9,000 - 9,999 | 5.68% | 4.33% |
| 10,000 - 14,999 | 22.01% | 24.27% |
| 15,000 - 19,999 | 11.14% | 18.10% |
| 20,000 - 29,999 | 11.93% | 18.01% |
| More than 30,000 | 14.90% | 24.75% |
Estimated number of Employed persons by Age group
| Age Group | %age of Employees |
| 15-19 | 1.00% |
| 20-29 | 18.36% |
| 30-39 | 25.30% |
| 40-49 | 24.39% |
| 50-59 | 23.24% |
| 60+ | 7.71% |
Estimated Monthly Earnings by Industry ( In HK$)
| Industry | Female | Male |
| Manufacturing | 10,500 | 16,500 |
| Construction | 13,000 | 15,600 |
| Import/export trade and wholesale | 15,000 | 20,000 |
| Retail, accommodation and food services | 10,000 | 13,600 |
| Transportation, storage, postal and courier services | 15,000 | 15,000 |
| Finance | 24,700 | 31,300 |
| Professional and business services | 12,000 | 18,000 |
| Public administration | 15,000 | 20,500 |
| Education | 20,000 | 27,000 |
| Other Industries | 14,500 | 20,000 |